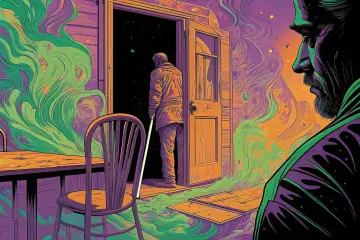
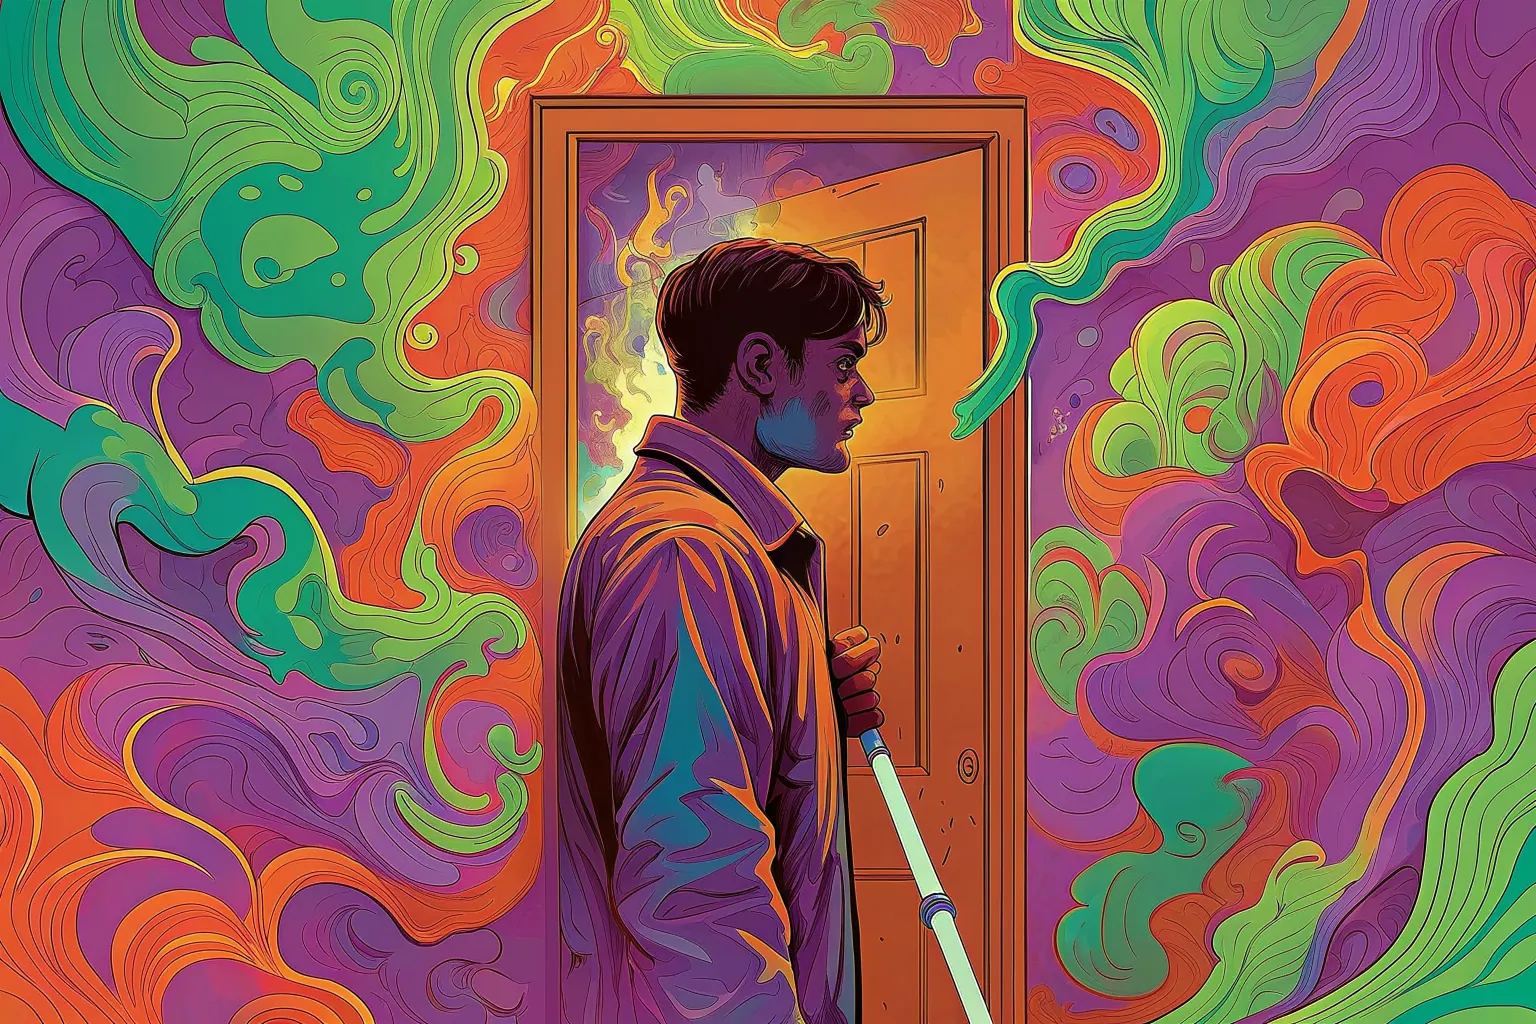
Draws this one again — same subject and the same people, a new palette and a new angle on it, described afresh. It replaces the drawing on this page for everyone, until somebody draws another. Costs the site about eight cents, and a few seconds.
Or press ←the left arrow and →the right arrow.
Who was not in the room when the data was designed?
Writing — read the piece
- Meant to show
- A blind stakeholder arriving after the wireframes were already printed: the person the reporting tool was about.
- Asked for
- An empty chair at a table crowded with wireframe printouts, a man in the doorway with a white cane already in use
- Drawn with (triad)
#b0663f#50c080#71448a
Why these three
Three points spaced evenly around the wheel — the furthest apart three hues can be.
- SeedSHA-256 of
who-was-not-in-the-room-when-the-data-was-designed, which is the same every time and different for every piece. - Base hueThe first two bytes as a fraction of 65,535, times 360 = 28°.
- GeometryThe third byte modulo 4 picks triad, which adds 0°, 120°, 240°.
- WobbleThree more bytes shift each by up to ±12° — −7.6°, −2.2°, +10.1° — so two pieces that draw the same geometry are still not the same shape on the wheel.
- Result
#b0663f21° at 64% saturation, 69% value#50c080146° at 58% saturation, 75% value#71448a278° at 50% saturation, 54% value
Saturation never drops below 72% and value never below 78%, which is what keeps a hue reading as the color it was chosen to be rather than as a dark. More on how these are made.