Inclusio: charts and diagrams blind and low-vision learners can use on their own
An NSF-funded platform that turns charts, graphics and documents into formats blind and low-vision learners can use on their own. My son Marcello Paiva and I built the prototype in Lovable on Supabase, and tested it with eight people. The part worth copying is a skip link that describes the page you are on.
- Role
- Accessibility review, research, information architecture, design system and the working prototype, with Marcello Paiva
- Year
- 2025
- Built with
- Lovable, Supabase, React, TypeScript, WCAG 2.2 AA, Screen readers
Inclusio turns educational material into formats that blind and low-vision learners can use without someone describing it to them: tactile graphics, audio, accessible SVG. Charts and diagrams are the hard part. It is funded by the National Science Foundation.
My son, Marcello Paiva, and I rebuilt its prototype over twelve weeks in the fall of 2025, as we had built WTFocus together. The brief covered an accessibility review against WCAG 2.2 AA, fourteen user flows, research with the people the platform is for, the information architecture down to its landmarks, and a design system.
We built it in Lovable, on Supabase, so what we tested was a working application and not a set of pictures of one. That mattered later. When a session turned something up, we changed the prototype and the next participant used the change, without waiting on a redesign.
A sidebar you cannot see
When I first looked at the tool, in August, the problems were plain. Cards ignored the switch between dark and light themes. An infinite scroll piled up more than anyone could hold in mind. The accessibility settings were hard to find. And the navigation lived in a left sidebar, beside the content instead of above it.
The sidebar was the one that mattered most. A sighted person takes in a page's layout in a glance, before reading a word: menu on the left, content in the middle, search across the top. A screen reader gives you the same page one element at a time, in source order, and leaves you to build the map yourself. A layout that breaks the usual top-to-bottom pattern makes that map harder to build, for exactly the people the platform serves.
So the question for the first weeks was how to hand someone the map.
The first answer was a key
The plan in September was a keyboard shortcut. Press K, to know the layout, from anywhere, and hear a description of the page. A skip link would point to it, and a first visit would announce that the key existed.
It never shipped that way. A single-key shortcut collides with the keys screen readers already use to move around a page, and the people this is for are the people that collision hurts. A shortcut also only helps someone who already knows it is there. The description needed to sit somewhere everyone passes, on every page, without having to be learned.
A skip link that describes the page
Everyone who uses a keyboard meets the skip links first. Press Tab on any page of the prototype and they appear across the top. Four of them do what skip links do: jump to the main content, the navigation, the search field or the login.
The second one does not skip anywhere. It is a button, and it says Describe page layout.
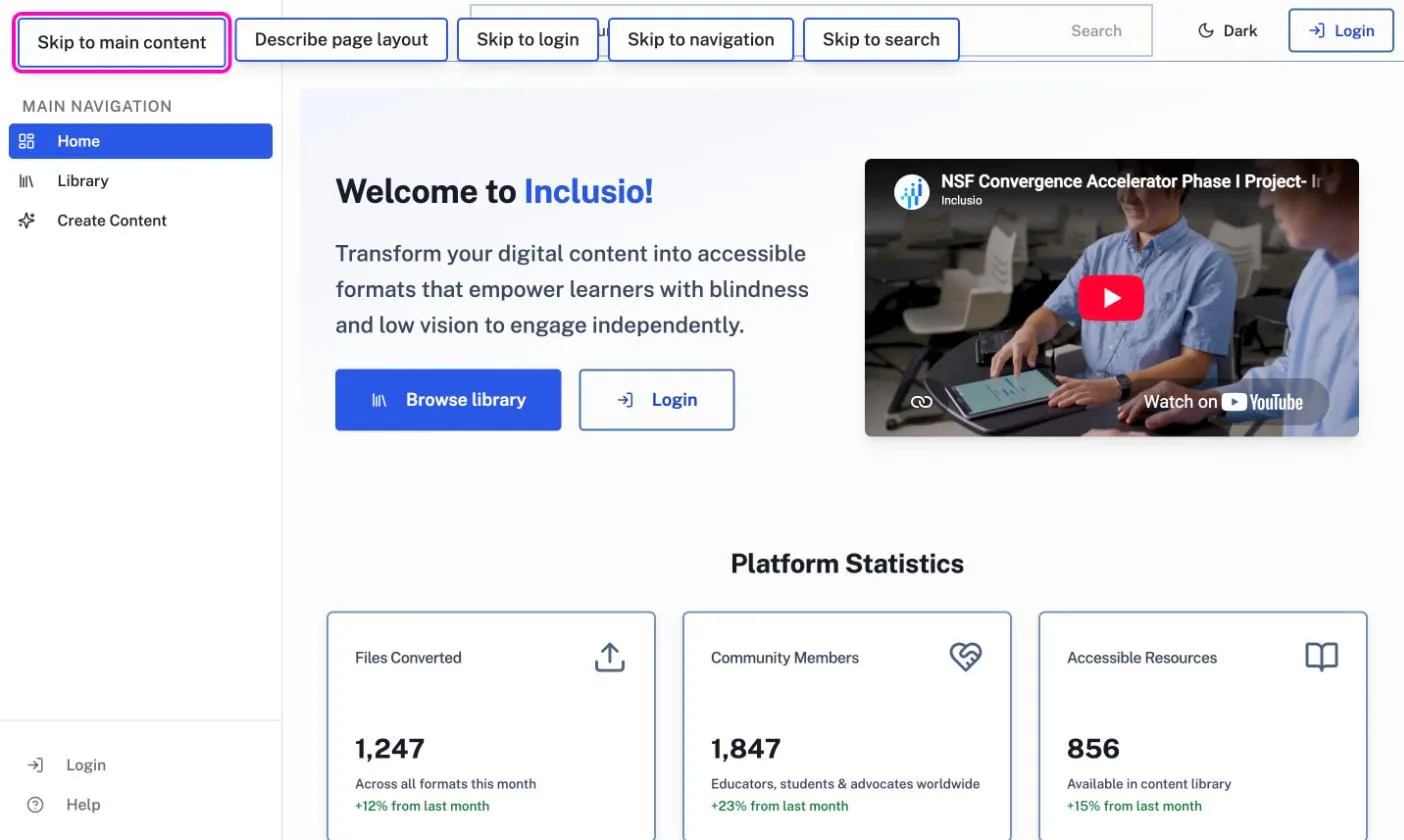
On the home page, it says:
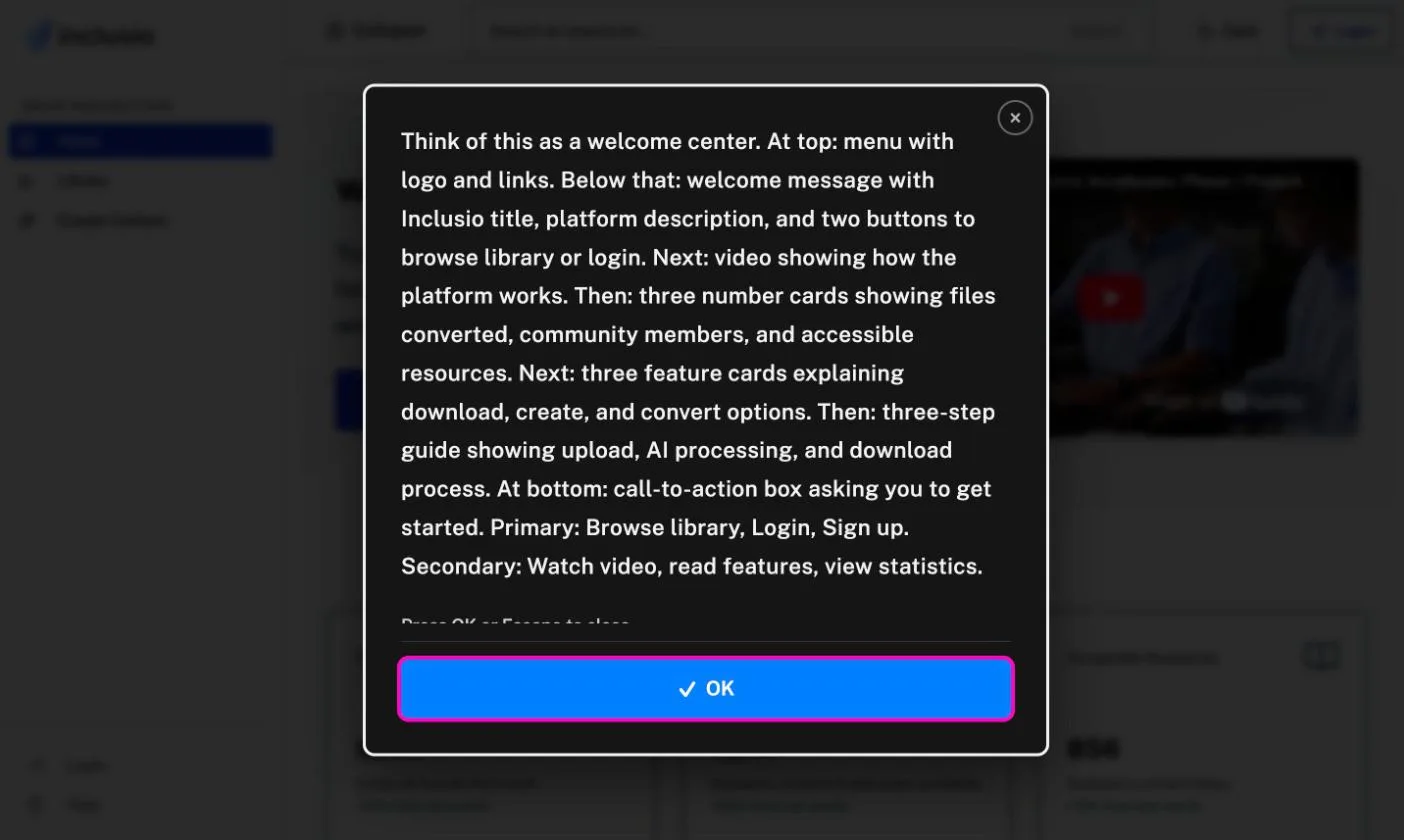
Think of this as a welcome center. At top: menu with logo and links. Below that: welcome message with Inclusio title, platform description, and two buttons to browse library or login.
It goes on through the video, the statistics, the feature cards and the call to action, and it ends with what you can do here, primary tasks first.
Every page has its own, written by hand in the same order: what this is like, how it is laid out, what you came to do, what else is here. The library is a digital catalog. The chart wizard is a guided wizard. The SVG editor is a digital art studio. One familiar comparison does more orientation than any list of regions.
A screen reader hears the description through a live region. A sighted keyboard user gets it on screen, in a dialog that holds focus, closes on Escape and hands focus back to the button. On a phone the same dialog closes with a tap or a swipe down.
Eight people, and what they changed
We interviewed eight people: educators of blind students, accessibility researchers and assistive-technology specialists. Five of them use a screen reader, and navigated the prototype with one while we watched. One came back for three sessions, so we could test a change on the person who had asked for it.
The feature they met first was not the one described above. Its label read Page layout structure, and its descriptions talked like a developer: nav, hero banner, metric cards. Screen reader users asked for plain words. The button became Describe page layout, and the descriptions were rewritten the way you would explain a room to someone standing in it.
The participant who came back three times reviews products for a living, with a screen reader. They called the feature very helpful and rare, and asked that it be kept as the thing that sets Inclusio apart. Another asked for the description to open inline, under the button, instead of in a dialog. That one is still open.
The sessions reached past the skip links. Skip to login now goes straight to the login page, as one participant asked. The content creation flow had started as the multi-step wizard everyone builds, one screen after another. Participants asked for the opposite: every step on one page, each expanding in place, so nobody is marched through screens they cannot see the end of. That is how it works now. And the charts the platform generated came out as static images to a screen reader, which is the kind of gap you only find by watching someone try.
Not only for blind users
A platform built for blind learners still has to work for the sighted teacher making the worksheet, the student with low vision, and the parent who is color blind. Most of what made it work for them came out of the same decisions.
Charts are the clearest case. The two series in a comparison differ by pattern as well as color, diagonal stripes against horizontal ones. So the chart still reads in grayscale, to someone who cannot tell the blue from the orange, and once it is embossed as a tactile graphic. Every bar carries its value, so nobody has to read numbers off an axis. The labels are real text, not pixels, which keeps them sharp under a screen magnifier.
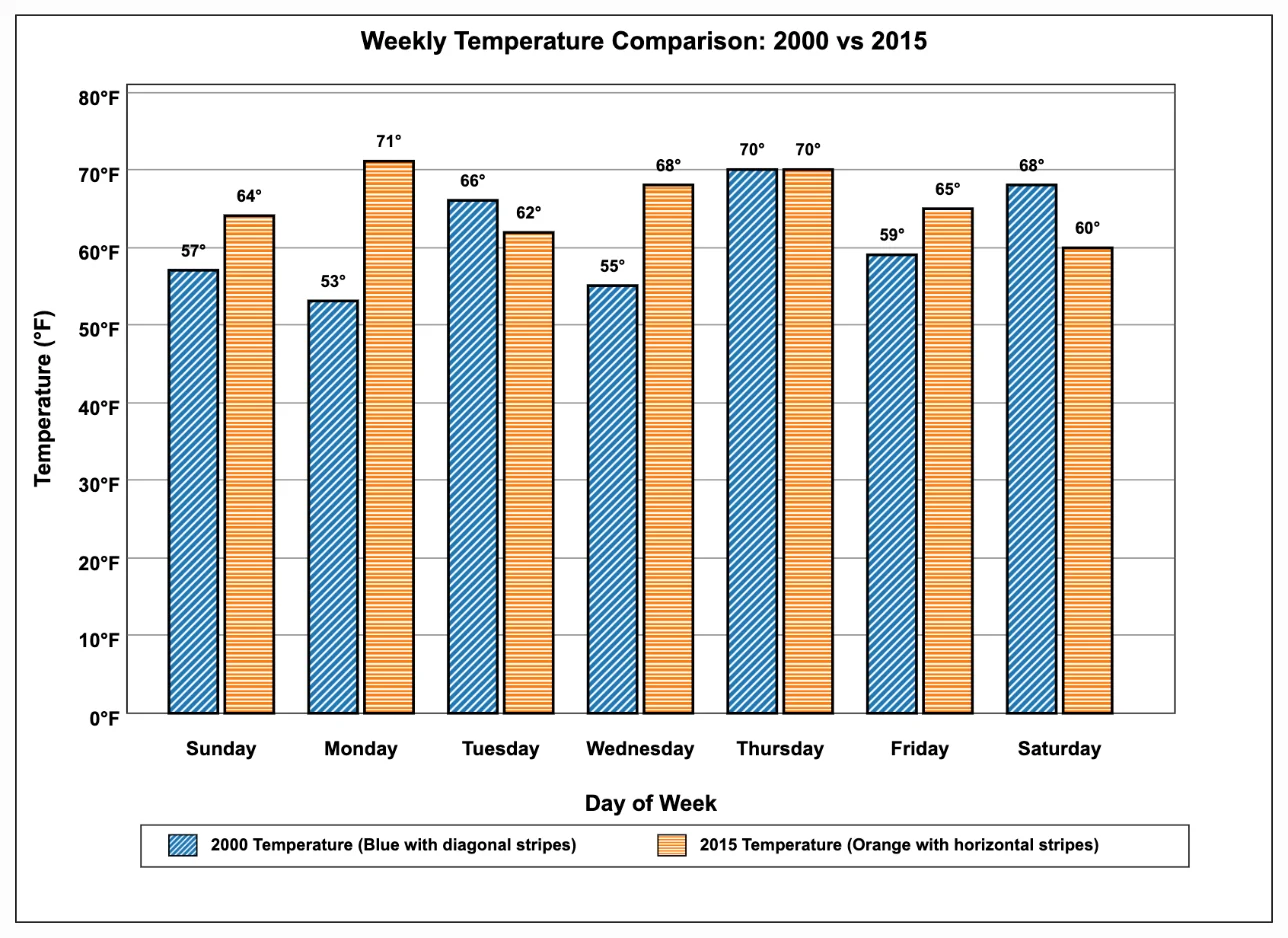
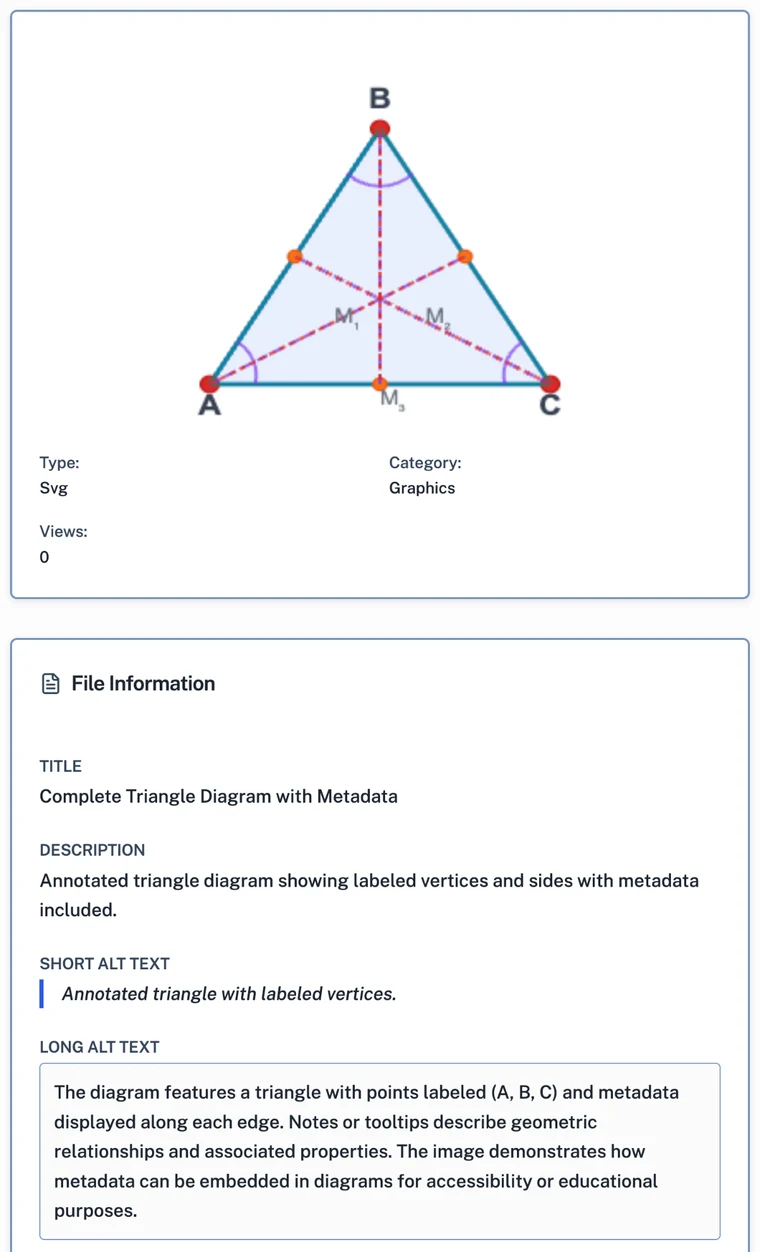
The chart's description is never hidden, either. On every resource page the short and long alt text sit under the image, where a sighted teacher can read what a student's screen reader will say. That is also how you catch a weak one.
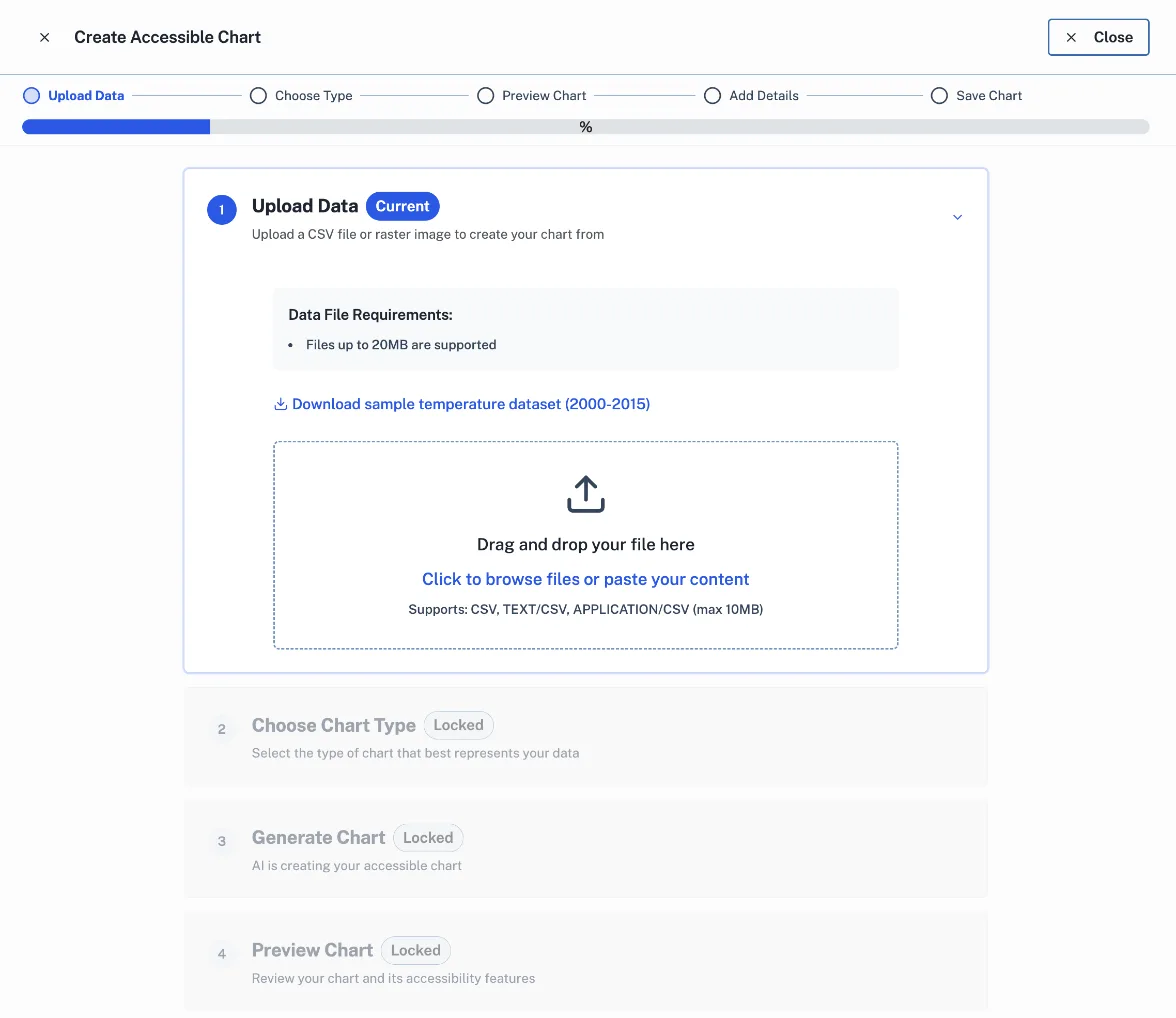
Making a chart is built the same way. The wizard opens full-screen, as one focused task with nothing else competing for attention. Its steps sit on one page and say where you are in words, Current and Locked, not by color alone. And the drop zone that asks you to drag a file in also lets you click to browse or paste the data, for anyone who cannot drag: a tremor, a switch, a keyboard.
What I would want copied
The prototype carries sixty or so accessibility components: page-change announcements, focus management after navigation, settings for contrast, text size, spacing and motion. Most of them are the work any accessible product needs.
The skip link is the one I would want other teams to take. It costs one button and a paragraph per page. It needs no new key to learn and no setting to find. And it answers the question every screen reader user has on a new page, before they have to work it out for themselves.
Or press ←the left arrow and →the right arrow.